import javax.swing.JFrame;
import javax.swing.SwingUtilities;
import org.jfree.chart.ChartFactory;
import org.jfree.chart.ChartPanel;
import org.jfree.chart.JFreeChart;
import org.jfree.chart.plot.PlotOrientation;
import org.jfree.data.category.CategoryDataset;
import org.jfree.data.category.DefaultCategoryDataset;
public class BarChartExample extends JFrame {
private static final long serialVersionUID = 1L;
public BarChartExample(String appTitle) {
super(appTitle);
// Create Dataset
CategoryDataset dataset = createDataset();
//Create chart
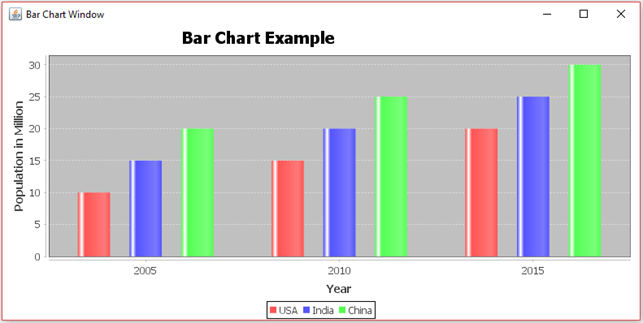
JFreeChart chart=ChartFactory.createBarChart(
"Bar Chart Example", //Chart Title
"Year", // Category axis
"Population in Million", // Value axis
dataset,
PlotOrientation.VERTICAL,
true,true,false
);
ChartPanel panel=new ChartPanel(chart);
setContentPane(panel);
}
private CategoryDataset createDataset() {
DefaultCategoryDataset dataset = new DefaultCategoryDataset();
// Population in 2005
dataset.addValue(10, "USA", "2005");
dataset.addValue(15, "India", "2005");
dataset.addValue(20, "China", "2005");
// Population in 2010
dataset.addValue(15, "USA", "2010");
dataset.addValue(20, "India", "2010");
dataset.addValue(25, "China", "2010");
// Population in 2015
dataset.addValue(20, "USA", "2015");
dataset.addValue(25, "India", "2015");
dataset.addValue(30, "China", "2015");
return dataset;
}
public static void main(String[] args) throws Exception {
SwingUtilities.invokeAndWait(()->{
BarChartExample example=new BarChartExample("Bar Chart Window");
example.setSize(800, 400);
example.setLocationRelativeTo(null);
example.setDefaultCloseOperation(WindowConstants.EXIT_ON_CLOSE);
example.setVisible(true);
});
}
}