R 二项分布
二项分布模型处理的是在一系列实验中找到只有两种可能结果的事件成功的概率。例如,抛硬币总是会产生正面或反面。在二项式分布中估计在重复抛硬币 10 次时恰好找到 3 个正面的概率。
R 有四个内置函数来生成二项式分布。它们描述如下。
dbinom(x, size, prob)
pbinom(x, size, prob)
qbinom(p, size, prob)
rbinom(n, size, prob)
以下是所用参数的说明-
x 是一个数字向量。
p 是概率向量。
n 是观察次数。
size 是试验次数。
prob 是每次试验成功的概率。
dbinom()
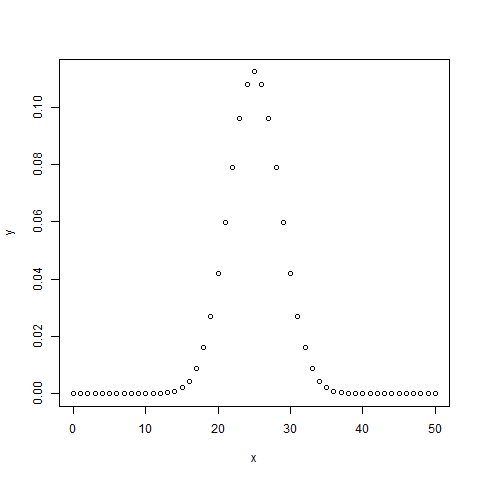
这个函数给出了每个点的概率密度分布。
# Create a sample of 50 numbers which are incremented by 1.
x <-seq(0,50,by = 1)
# Create the binomial distribution.
y <-dbinom(x,50,0.5)
# Give the chart file a name.
png(file = "dbinom.png")
# Plot the graph for this sample.
plot(x,y)
# Save the file.
dev.off()
当我们执行上面的代码时,它会产生以下结果-
pbinom()
此函数给出事件的累积概率。它是表示概率的单个值。
# Probability of getting 26 or less heads from a 51 tosses of a coin.
x <-pbinom(26,51,0.5)
print(x)
当我们执行上面的代码时,它会产生以下结果-
qbinom()
此函数取概率值并给出一个其累积值与概率值匹配的数字。
# How many heads will have a probability of 0.25 will come out when a coin
# is tossed 51 times.
x <-qbinom(0.25,51,1/2)
print(x)
当我们执行上面的代码时,它会产生以下结果-
rbinom()
此函数从给定样本中生成给定概率的所需数量的随机值。
# Find 8 random values from a sample of 150 with probability of 0.4.
x <-rbinom(8,150,.4)
print(x)
当我们执行上面的代码时,它会产生以下结果-
[1] 58 61 59 66 55 60 61 67

