密度图
密度图详细教程
获得每个属性分布的另一种快速简便的技术是密度图。它也类似于直方图,但在每个容器的顶部都有一条平滑的曲线。我们可以将它们称为抽象直方图。
示例
在以下示例中,Python脚本将生成"密度图",用于分布Pima印度糖尿病数据集的属性。
# Filename : example.py
# Copyright : 2020 By Lidihuo
# Author by : www.lidihuo.com
# Date : 2020-08-27
from matplotlib import pyplot
from pandas import read_csv
path = r"C:\pima-indians-diabetes.csv"
names = ['preg', 'plas', 'pres', 'skin', 'test', 'mass', 'pedi', 'age', 'class']
data = read_csv(path, names=names)
data.plot(kind='density', subplots=True, layout=(3,3), sharex=False)
pyplot.show()
输出
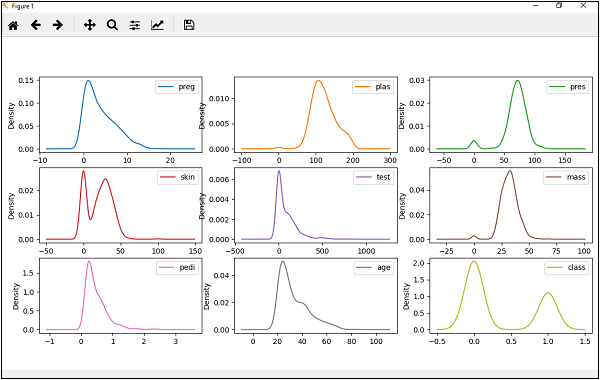
从上面的输出中,可以很容易地理解密度图和直方图之间的差异。

