Python 绘制柱状图和折线图
Python 绘制柱状图和折线图的例子
下面使用 4 种常见的绘图库绘制柱状图和折线图,使用尽可能最少的代码绘制,快速入门这些库是本文的写作目的。
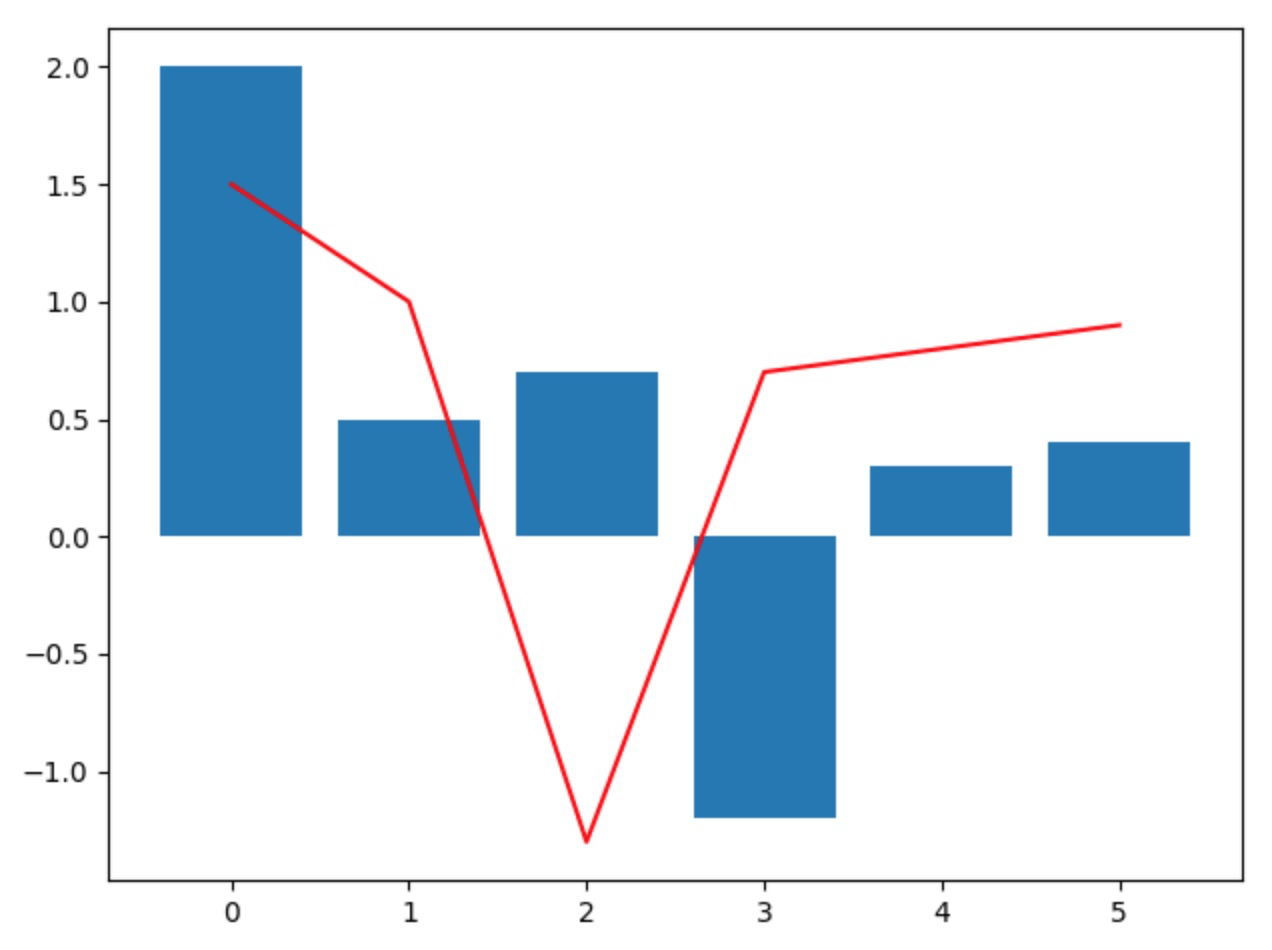
matplotlib 绘图
# Filename : example.py
# DateTime : 2020-07-20
# author by : www.lidihuo.com
# 导入包:
import matplotlib
matplotlib.__version__ # '2.2.2'
绘图代码:
import matplotlib.pyplot as plt
plt.plot([0, 1, 2, 3, 4, 5],
[1.5, 1, -1.3, 0.7, 0.8, 0.9]
,c='red')
plt.bar([0, 1, 2, 3, 4, 5],
[2, 0.5, 0.7, -1.2, 0.3, 0.4]
)
plt.show()
运行结果
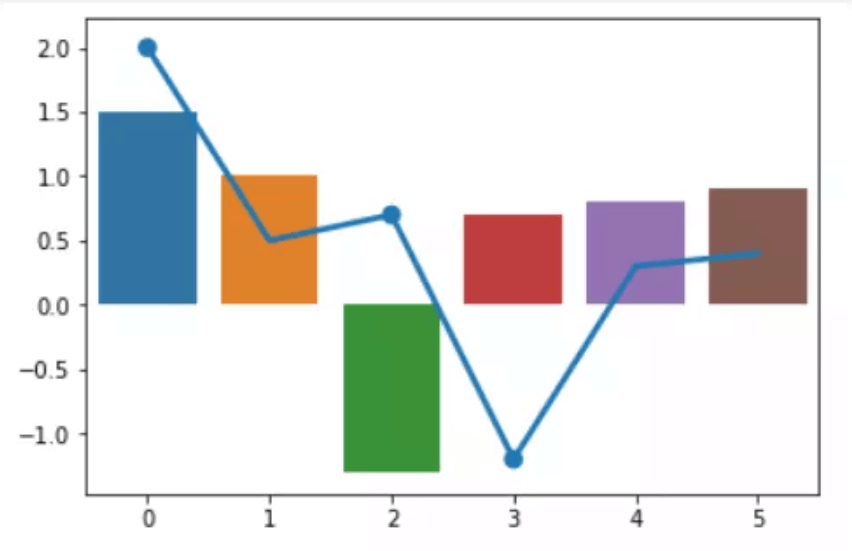
seaborn 绘图
# Filename : example.py
# DateTime : 2020-07-20
# author by : www.lidihuo.com
import seaborn as sns
import matplotlib.pyplot as plt
from pyecharts.charts import Line, Bar
sns.__version__ # '0.8.0'
sns.barplot([0, 1, 2, 3, 4, 5],
[1.5, 1, -1.3, 0.7, 0.8, 0.9]
)
sns.pointplot([0, 1, 2, 3, 4, 5],
[2, 0.5, 0.7, -1.2, 0.3, 0.4]
)
plt.show()
运行结果
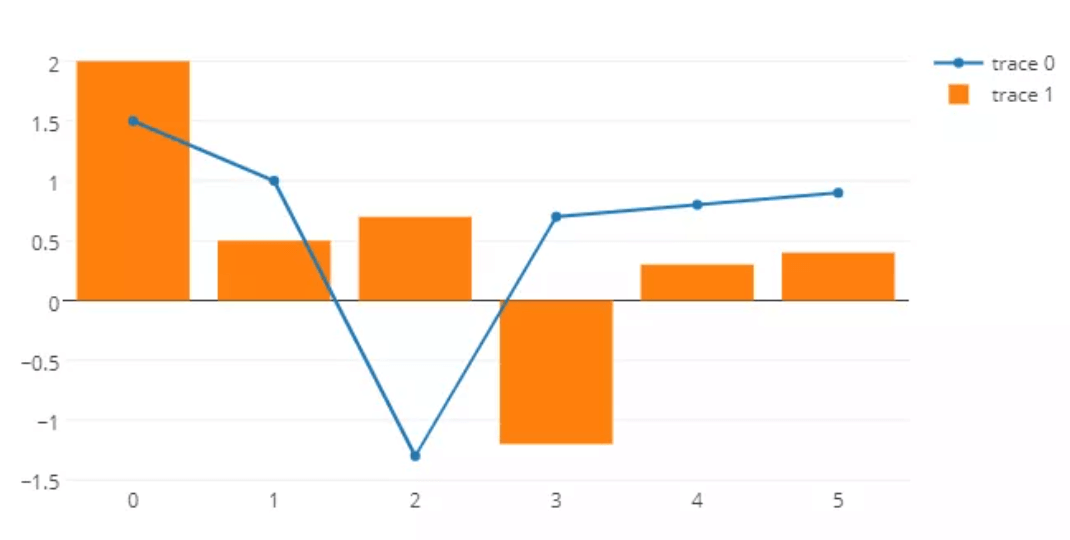
plotly 绘图
# Filename : example.py
# DateTime : 2020-07-20
# author by : www.lidihuo.com
import plotly
plotly.__version__ # '2.0.11'
import plotly.graph_objs as go
import plotly.offline as offline
pyplt = offline.plot
sca = go.Scatter(x=[0, 1, 2, 3, 4, 5],
y=[1.5, 1, -1.3, 0.7, 0.8, 0.9]
)
bar = go.Bar(x=[0, 1, 2, 3, 4, 5],
y=[2, 0.5, 0.7, -1.2, 0.3, 0.4]
)
fig = go.Figure(data = [sca,bar])
pyplt(fig)
运行结果
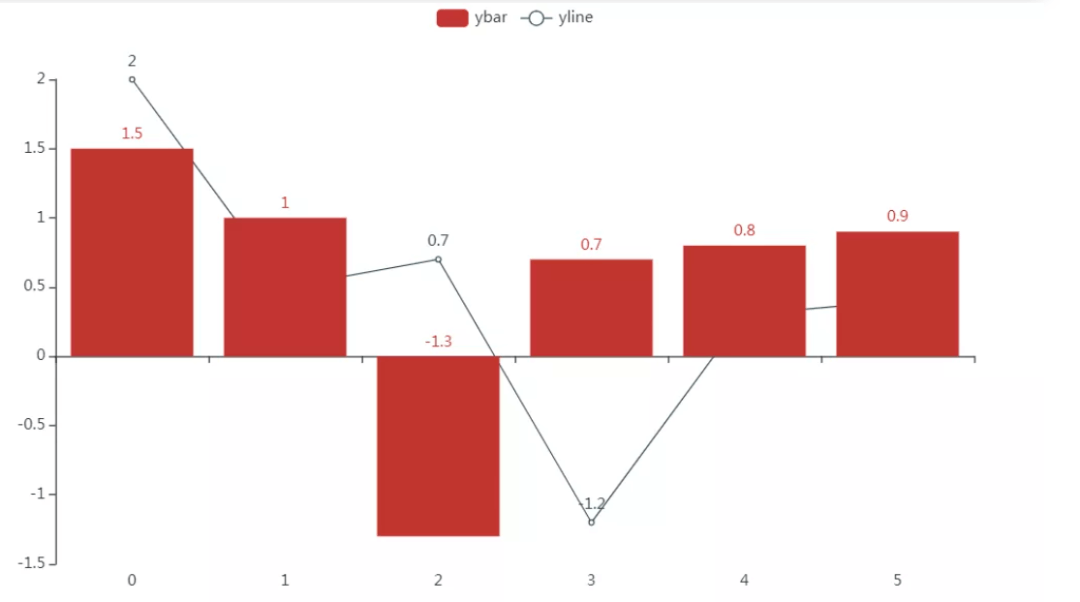
pyecharts 绘图
# Filename : example.py
# DateTime : 2020-07-20
# author by : www.lidihuo.com
import pyecharts
pyecharts.__version__ # '1.7.1'
bar = (
Bar()
.add_xaxis([0, 1, 2, 3, 4, 5])
.add_yaxis('ybar',[1.5, 1, -1.3, 0.7, 0.8, 0.9])
)
line = (Line()
.add_xaxis([0, 1, 2, 3, 4, 5])
.add_yaxis('yline',[2, 0.5, 0.7, -1.2, 0.3, 0.4])
)
bar.overlap(line)
bar.render_notebook()
运行结果
大家在复现代码时,需要注意API与包的版本紧密相关,与上面版本不同的包其内的API可能与以上写法有略有差异,大家根据情况自行调整即可。
matplotlib 绘制三维 3D 图形的方法,主要锁定在绘制 3D 曲面图和等高线图。

