Python地理地图
Python地理地图详细操作教程
现在已经创建了许多开源python库来表示地理地图。 它们高度可定制,并提供各种地图,描绘不同形状和颜色的区域。 一个包是Cartopy。 可以从Cartopy的本地环境下载并安装此软件包。可以在
画廊找到很多例子。
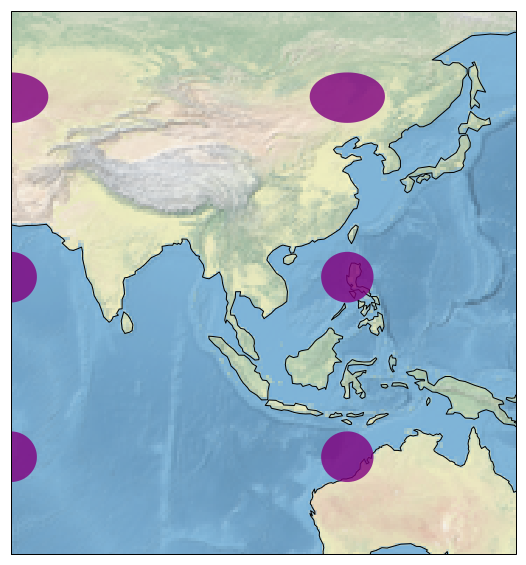
在下面的例子中,我们展示了部分亚洲和澳大利亚的世界地图。 可以调整方法set_extent中的参数值以查找世界地图的不同区域。
# Filename : example.py
# Copyright : 2020 By Lidihuo
# Author by : www.lidihuo.com
# Date : 2020-08-23
import matplotlib.pyplot as plt
import cartopy.crs as ccrs
fig = plt.figure(figsize=(15, 10))
ax = fig.add_subplot(1, 1, 1, projection=ccrs.PlateCarree())
# make the map global rather than have it zoom in to
# the extents of any plotted data
ax.set_extent((60, 150, 55, -25))
ax.stock_img()
ax.coastlines()
ax.tissot(facecolor='purple', alpha=0.8)
plt.show()
执行上面示例代码,得到以下结果 -