Python正态分布
Python正态分布详细操作教程
正态分布是通过排列数据中每个值的概率分布来呈现数据的形式。大多数值保持在平均值附近,使得排列对称。
可使用numpy库中各种函数来数学计算正态分布的值。 通过绘制概率分布曲线来创建直方图。
# Filename : example.py
# Copyright : 2020 By Lidihuo
# Author by : www.lidihuo.com
# Date : 2020-08-23
import matplotlib.pyplot as plt
import numpy as np
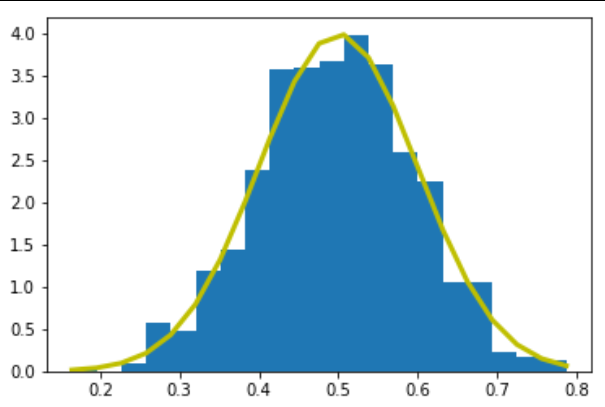
mu, sigma = 0.5, 0.1
s = np.random.normal(mu, sigma, 1000)
# Create the bins and histogram
count, bins, ignored = plt.hist(s, 20, normed=True)
# Plot the distribution curve
plt.plot(bins, 1/(sigma * np.sqrt(2 * np.pi)) *
np.exp( - (bins - mu)**2 / (2 * sigma**2) ), linewidth=3, color='y')
plt.show()
执行上面示例代码,得到以下结果 -