数据分析 K-Means聚类
k-means 聚类旨在将 n 个观测值划分为 k 个聚类,其中每个观测值属于具有最近均值的聚类,作为聚类的原型。这导致将数据空间划分为 Voronoi 单元。
给定一组观测值
(x1, x2, …, xn),其中每个观测值都是一个 d 维实向量,k-means 聚类旨在将 n 个观测值划分为 k 个组
G = {G1, G2, ... , Gk} 以最小化簇内平方和 (WCSS),定义如下-
$$argmin \: \sum_{i = 1}^{k} \sum_{x \in S_{i}}\parallel x-\mu_{i}\parallel ^2$$
后面的公式显示了最小化的目标函数,以便在 k-means 聚类中找到最佳原型。公式的直觉是我们想找到彼此不同的组,每个组的每个成员都应该与每个集群的其他成员相似。
以下示例演示了如何在 R 中运行 k-means 聚类算法。
library(ggplot2)
# Prepare Data
data = mtcars
# We need to scale the data to have zero mean and unit variance
data <-scale(data)
# Determine number of clusters
wss <-(nrow(data)-1)*sum(apply(data,2,var))
for (i in 2:dim(data)[2]) {
wss[i] <-sum(kmeans(data, centers = i)$withinss)
}
# Plot the clusters
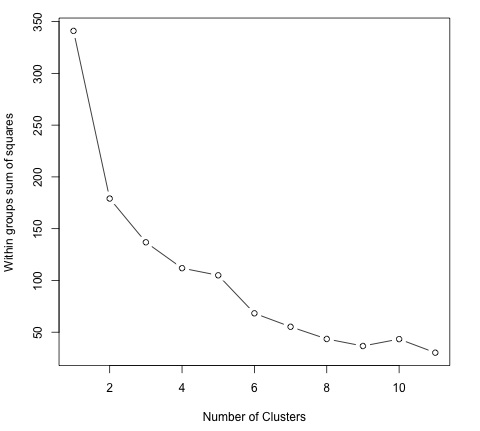
plot(1:dim(data)[2], wss, type = "b", xlab = "Number of Clusters",
ylab = "Within groups sum of squares")
为了找到合适的 K 值,我们可以绘制不同 K 值的组内平方和。这个度量通常随着添加更多组而减少,我们想找到一个点组内平方和开始缓慢下降。在图中,这个值最好用 K = 6 来表示。
既然已经定义了 K 的值,需要使用该值运行算法。
# K-Means Cluster Analysis
fit <-kmeans(data, 5) # 5 cluster solution
# get cluster means
aggregate(data,by = list(fit$cluster),FUN = mean)
# append cluster assignment
data <-data.frame(data, fit$cluster)

