Matplotlib箱线图
Matplotlib箱线图详细操作教程
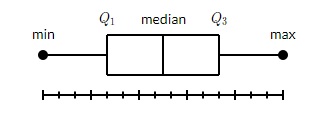
箱形图也称为须状图,显示包含最小值,第一四分位数,中位数,第三四分位数和最大值的一组数据的摘要。在方块图中,绘制从第一个四分位数到第三个四分位数的方框。垂直线穿过中间的框。须状从每个四分位数到最小值或最大值。
让我们为箱形图创建数据。使用numpy.random.normal()函数来创建虚假数据。它需要三个参数,正态分布的均值和标准差,以及所需的值的数量。
# Filename : example.py
# Copyright : 2020 By Lidihuo
# Author by : www.lidihuo.com
# Date : 2020-08-24
np.random.seed(10)
collectn_1 = np.random.normal(100, 10, 200)
collectn_2 = np.random.normal(80, 30, 200)
collectn_3 = np.random.normal(90, 20, 200)
collectn_4 = np.random.normal(70, 25, 200)
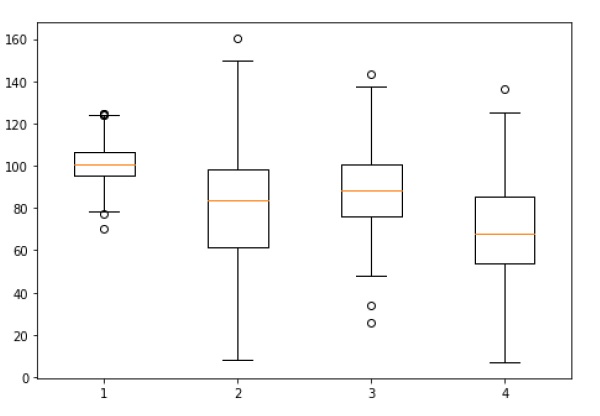
上面创建的数组列表是创建boxplot所需的唯一输入。使用data_to_plot代码行,可以使用以下代码创建boxplot -
# Filename : example.py
# Copyright : 2020 By Lidihuo
# Author by : www.lidihuo.com
# Date : 2020-08-24
fig = plt.figure()
# Create an axes instance
ax = fig.add_axes([0,0,1,1])
# Create the boxplot
bp = ax.boxplot(data_to_plot)
plt.show()
执行上面的代码行将生成以下输出 -