Matplotlib subplot2grid()函数
Matplotlib subplot2grid()函数详细操作教程
Matplotlib subplot2grid()函数在网格的特定位置创建轴对象提供了更大的灵活性。它还允许轴对象跨越多个行或列。
# Filename : example.py
# Copyright : 2020 By Lidihuo
# Author by : www.lidihuo.com
# Date : 2020-08-24
plt.subplot2grid(shape, location, rowspan, colspan)
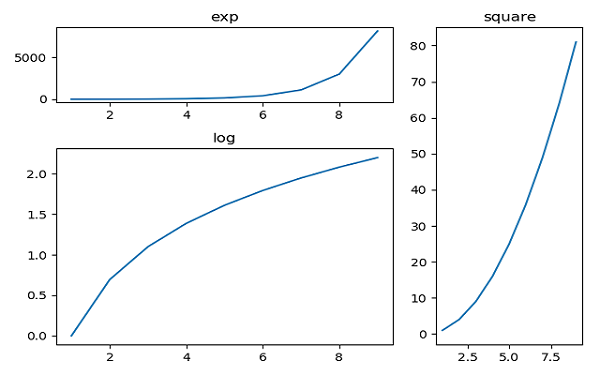
在下面的示例中,图形对象的3X3网格填充了行和列跨度中不同大小的轴对象,每个对象显示不同的图。
参考以下示例代码:
# Filename : example.py
# Copyright : 2020 By Lidihuo
# Author by : www.lidihuo.com
# Date : 2020-08-24
#! /usr/bin/env python
#coding=utf-8
import matplotlib.pyplot as plt
import numpy as np
import math
# 显示中文设置...
plt.rcParams['font.sans-serif'] = ['SimHei'] # 步骤一(替换sans-serif字体)
plt.rcParams['axes.unicode_minus'] = False # 步骤二(解决坐标轴负数的负号显示问题)
a1 = plt.subplot2grid((3,3),(0,0),colspan = 2)
a2 = plt.subplot2grid((3,3),(0,2), rowspan = 3)
a3 = plt.subplot2grid((3,3),(1,0),rowspan = 2, colspan = 2)
x = np.arange(1,10)
a2.plot(x, x*x)
a2.set_title('平方')
a1.plot(x, np.exp(x))
a1.set_title('指数')
a3.plot(x, np.log(x))
a3.set_title('log')
plt.tight_layout()
plt.show()
执行上面示例代码,得到以下结果 -