Matplotlib数学表达式
Matplotlib数学表达式详细操作教程
可以将任何Matplotlib文本字符串中的子集TeXmarkup放在一对美元符号($)中。
# Filename : example.py
# Copyright : 2020 By Lidihuo
# Author by : www.lidihuo.com
# Date : 2020-08-24
# math text
plt.title(r'$\alpha > \beta)
)
要制作下标和上标,请使用_和^符号 -
r'$\alpha_i> \beta_i$'
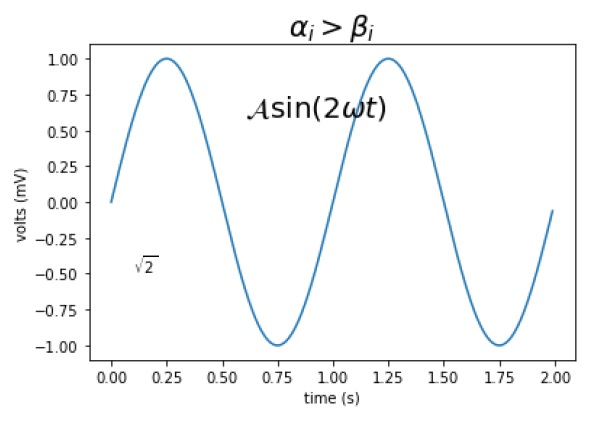
import numpy as np
import matplotlib.pyplot as plt
t = np.arange(0.0, 2.0, 0.01)
s = np.sin(2*np.pi*t)
plt.plot(t,s)
plt.title(r'$\alpha_i> \beta_i$', fontsize=20)
plt.text(0.6, 0.6, r'$\mathcal{A}\mathrm{sin}(2 \omega t)$', fontsize = 20)
plt.text(0.1, -0.5, r'$\sqrt{2}$', fontsize=10)
plt.xlabel('time (s)')
plt.ylabel('volts (mV)')
plt.show()
执行上面示例代码,得到以下结果 -