Matplotlib Multiplots
Matplotlib Multiplots详细操作教程
在本章中,我们将学习如何在同一画布上创建多个子图。
subplot()函数返回给定网格位置的axes对象。此函数的签名是 -
# Filename : example.py
# Copyright : 2020 By Lidihuo
# Author by : www.lidihuo.com
# Date : 2020-08-24
plt.subplot(subplot(nrows, ncols, index)
在当前图中,该函数创建并返回一个Axes对象,在ncolsaxes的nrows网格的位置索引处。索引从1到nrows * ncols,以行主顺序递增。如果nrows,ncols和index都小于10。索引也可以作为单个,连接,三个数字给出。
例如,subplot(2, 3, 3)和subplot(233)都在当前图形的右上角创建一个轴,占据图形高度的一半和图形宽度的三分之一。
创建子图将删除任何与其重叠的预先存在的子图,而不是共享边界。
参考以下示例代码:
# Filename : example.py
# Copyright : 2020 By Lidihuo
# Author by : www.lidihuo.com
# Date : 2020-08-24
#! /usr/bin/env python
#coding=utf-8
import matplotlib.pyplot as plt
# 显示中文设置...
plt.rcParams['font.sans-serif'] = ['SimHei'] # 步骤一(替换sans-serif字体)
plt.rcParams['axes.unicode_minus'] = False # 步骤二(解决坐标轴负数的负号显示问题)原文出自【立地货】,商业转载请联系作者获得授权,非商业请保留原文链接
# plot a line, implicitly creating a subplot(111)
plt.plot([1,2,3])
# now create a subplot which represents the top plot of a grid with 2 rows and 1 column.
#Since this subplot will overlap the first, the plot (and its axes) previously created, will be removed
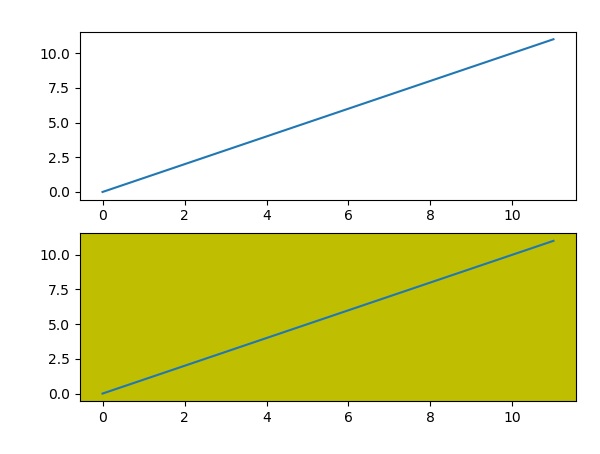
plt.subplot(211)
plt.plot(range(12))
plt.subplot(212, facecolor='y') # creates 2nd subplot with yellow background
plt.plot(range(12))
plt.show()
执行上面示例代码,得到以下结果:
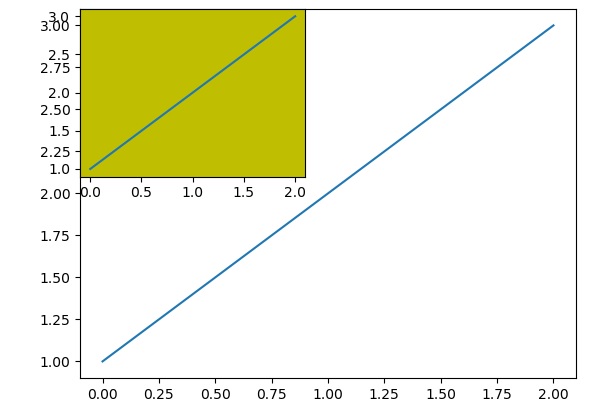
figure类的add_subplot()函数不会覆盖现有的图,参考以下代码 -
# Filename : example.py
# Copyright : 2020 By Lidihuo
# Author by : www.lidihuo.com
# Date : 2020-08-24
#! /usr/bin/env python
#coding=utf-8
import matplotlib.pyplot as plt
# 显示中文设置...
plt.rcParams['font.sans-serif'] = ['SimHei'] # 步骤一(替换sans-serif字体)
plt.rcParams['axes.unicode_minus'] = False # 步骤二(解决坐标轴负数的负号显示问题)
fig = plt.figure()
ax1 = fig.add_subplot(111)
ax1.plot([1,2,3])
ax2 = fig.add_subplot(221, facecolor='y')
ax2.plot([1,2,3])
plt.show()
执行上面示例代码,得到以下结果:
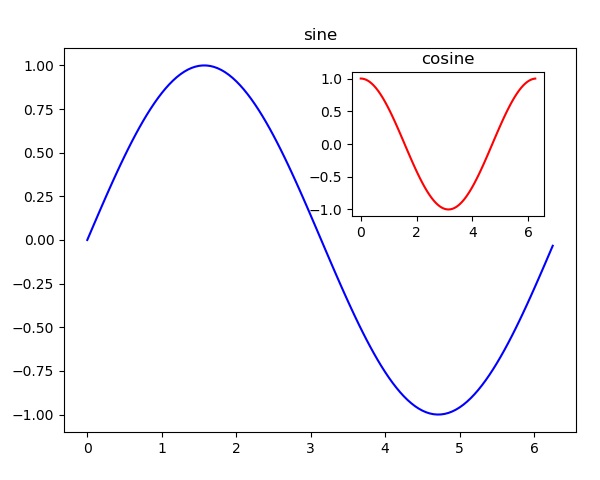
可以通过在同一图形画布中添加另一个轴对象来在同一图中添加插入图。参考以下实现代码 -
# Filename : example.py
# Copyright : 2020 By Lidihuo
# Author by : www.lidihuo.com
# Date : 2020-08-24
#! /usr/bin/env python
#coding=utf-8
import matplotlib.pyplot as plt
import numpy as np
import math
# 显示中文设置...
plt.rcParams['font.sans-serif'] = ['SimHei'] # 步骤一(替换sans-serif字体)
plt.rcParams['axes.unicode_minus'] = False # 步骤二(解决坐标轴负数的负号显示问题)
x = np.arange(0, math.pi*2, 0.05)
fig=plt.figure()
axes1 = fig.add_axes([0.1, 0.1, 0.8, 0.8]) # main axes
axes2 = fig.add_axes([0.55, 0.55, 0.3, 0.3]) # inset axes
y = np.sin(x)
axes1.plot(x, y, 'b')
axes2.plot(x,np.cos(x),'r')
axes1.set_title('正弦')
axes2.set_title("余弦")
plt.show()
执行上面示例代码,得到以下结果: