Plotly 内联绘图
在本章中,我们将学习如何使用 Jupyter Notebook 进行内联绘图。
为了在 notebook 中显示 plot,你需要按如下方式启动 plotly 的 notebook 模式-
from plotly.offline import init_notebook_mode
init_notebook_mode(connected = true)
保持脚本的其余部分不变,然后按
Shift+Enter 运行笔记本单元。图表将在 not 内离线显示电子书本身。
import plotly
plotly.tools.set_credentials_file(username = 'lathkar', api_key = '************')
from plotly.offline import iplot, init_notebook_mode
init_notebook_mode(connected = true)
import plotly
import plotly.graph_objs as go
import numpy as np
import math #needed for definition of pi
xpoints = np.arange(0, math.pi*2, 0.05)
ypoints = np.sin(xpoints)
trace0 = go.Scatter(
   x = xpoints, y = ypoints
)
data = [trace0]
plotly.offline.iplot({ "data": data,"layout": go.Layout(title="Sine wave")})
Jupyter notebook 输出如下所示-
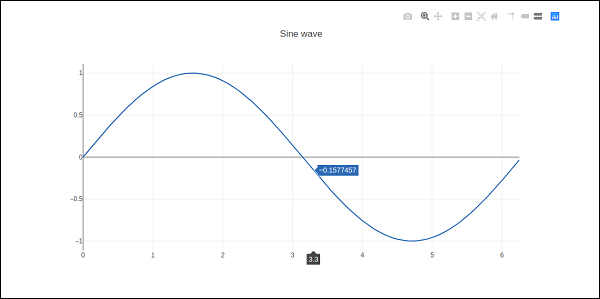
绘图输出在
右上角显示一个
工具栏。它包含用于下载
png、放大
和缩小、框和套索、选择和悬停的按钮。