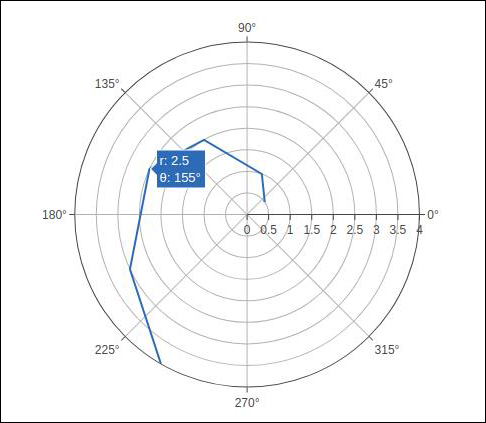
import numpy as np
r1 = [0,6,12,18,24,30,36,42,48,54,60]
t1 = [1,0.995,0.978,0.951,0.914,0.866,0.809,0.743,0.669,0.588,0.5]
trace = go.Scatterpolar(
   r = [0.5,1,2,2.5,3,4],
   theta = [35,70,120,155,205,240],
   mode = 'lines',
)
data = [trace]
fig = go.Figure(data = data)
iplot(fig)
y,x1,x2,x3,x4,x5,
0,1,1,1,1,1,
6,0.995,0.997,0.996,0.998,0.997,
12,0.978,0.989,0.984,0.993,0.986,
18,0.951,0.976,0.963,0.985,0.969,
24,0.914,0.957,0.935,0.974,0.946,
30,0.866,0.933,0.9,0.96,0.916,
36,0.809,0.905,0.857,0.943,0.88,
42,0.743,0.872,0.807,0.923,0.838,
48,0.669,0.835,0.752,0.901,0.792,
54,0.588,0.794,0.691,0.876,0.74,
60,0.5,0.75,0.625,0.85,0.685,
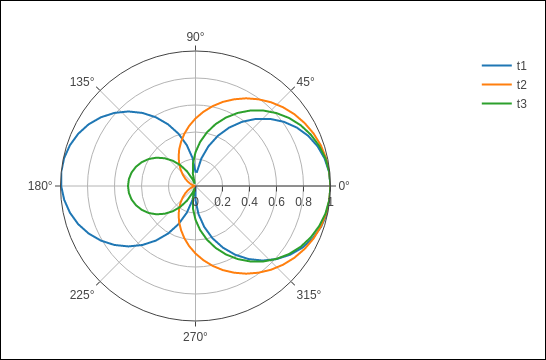
import pandas as pd
df = pd.read_csv("polar.csv")
t1 = go.Scatterpolar(
   r = df['x1'], theta = df['y'], mode = 'lines', name = 't1'
)
t2 = go.Scatterpolar(
   r = df['x2'], theta = df['y'], mode = 'lines', name = 't2'
)
t3 = go.Scatterpolar(
   r = df['x3'], theta = df['y'], mode = 'lines', name = 't3'
)
data = [t1,t2,t3]
fig = go.Figure(data = data)
iplot(fig)
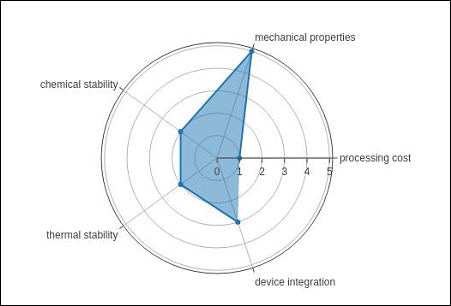
radar = go.Scatterpolar(
   r = [1, 5, 2, 2, 3],
   theta = [
      'processing cost',
      'mechanical properties',
      'chemical stability',
      'thermal stability',
      'device integration'
   ],
   fill = 'toself'
)
data = [radar]
fig = go.Figure(data = data)
iplot(fig)